
ShowingTime’s MarketStats products that include InfoSparks and FastStats provide real estate professionals with an easy way to generate market reports and brand yourself the expert. MarketStats products help you visualize your market, enabling you to analyze trends and share information with your clients.


Compare trends of up to four geographies at the same time (including custom defined geographies) and create shareable reports. Users just select an area, choose a metric, filter results and share! The agent and office information will be automatically populated from the MLS and users can add a profile photo so that all created reports are branded to them in static or live charts that can easily be shared or embedded on websites and social media. When a consumer asks if it’s a buyer’s or seller’s market, users will always quickly have the answer by being familiar with the latest Months’ Supply of Inventory figures.
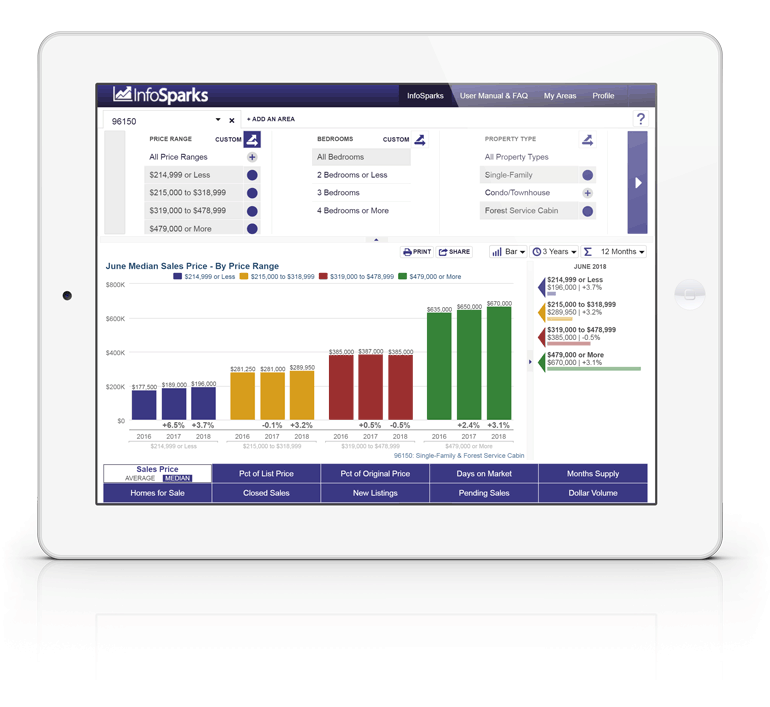
- Compare Geographies. Compare up to four geographies by a variety of housing variables, market metrics and time calculations.
- Analyze Data. Investigate important market metrics by county, city, postal code, neighborhood and other geographies.
- Branded Charts. Personalize market charts with your headshot, company name and contact information.
- Share or Store. Embed charts on blogs, websites and social media profiles so they’re always up to date, or download raw data to create your own branded charts for marketing purposes.
Access InfoSparks by clicking on the InfoSparks icon attached to any listing on your MLS Dashboard, on the Clareity Dashboard on Matrix, or on the Stratus InfoCenter under Resources.
SUPPORT INFORMATION
We have a separate Customer Experience team that your members can contact directly for assistance, 7 days a week.
Quick Tip: We always recommend your members contact Customer Experience via our remote chat feature if they want to quickly connect with a support associate.
ShowingTime Customer Experience
Click here to chat with us online.
Email: support@showingtime.com
Hours: Monday–Friday, 9am–9pm Eastern | Saturday–Sunday, 9am–6pm Eastern